Here Comes the Rain - Part 1
Summer 2012 may be remembered for the Olympic Games. Or it may be remembered for the rain. From doom laden predictions of the worst drought for a generation in the southern half of Britain with disastrous consequences for farmers in the spring to torrential rain, floods and, yes, disastrous consequences for farmers in the summer.
The burning question is whether this is just the natural variability of weather or whether underlying climate change has a hand in driving these weather systems. To investigate this question, I have studied some local weather records. My statistical skills are about High School level: mean and standard deviation of a normal distribution.
Data for Glasgow Airport from 1959 to 2012 was obtained from the Meteorological Office website but the 2012 data was discarded as it is only provisional and represents an incomplete year. The data included monthly rainfall, sunshine and maximum and minimum temperatures and the focus of this study was the rainfall data.
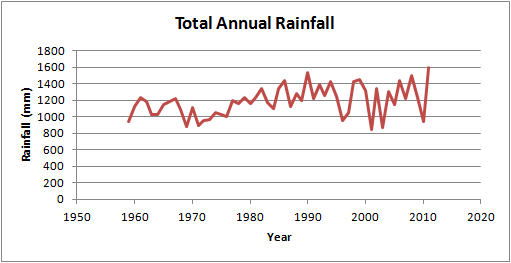
Annual rainfall figures are plotted below as a time series. The y-axis (rainfall) is drawn from zero to give a clearer picture of the relative changes; some graphs cut off the bottom which can visually exaggerate trends. Without performing any statistical analysis, the first impression is that annual rainfall has increased from the early 1970s to the mid 1990s before increasing again from around 2000 to the present time. The variability from year to year also appears to be greater in the more recent results, especially in the 2000s.
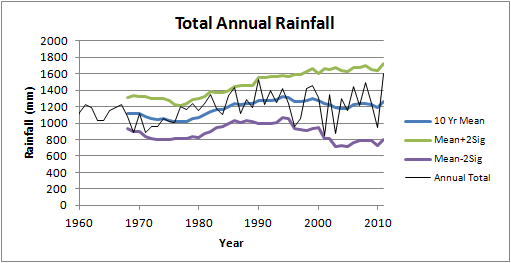
Variability of results is commonly measured using standard deviation of the measurements and from this the probability of outlying results can be assessed. Ninety five percent of measurements would be expected within a range of plus or minus 1.98 times the standard deviation from the mean. This has been rounded to two times the standard deviation and plotted on the graph above (Mean+2Sigma. Mean-2Sigma). The standard deviation has been applied in a similar way to the rolling average by calculating it over ten annual measurements then plotting against the last year of the ten. The original observation regarding increasing variability is supported by these plots. The graph below plots the standard deviation as a percentage of the mean to give a clearer picture of the scale of changing variability. There is a significant and rapid change from around 10% until 1995 before jumping to almost 20% by 2003.

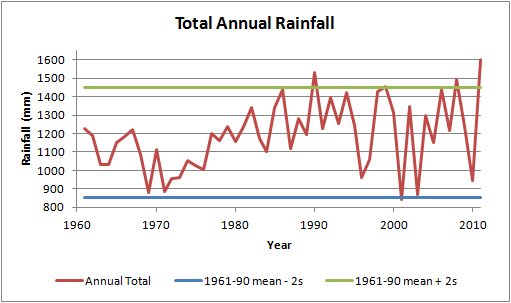
The final plot,below, shows the original data plotted alongside the 2 sigma values taken from the full data set from 1961 to 1990, a thirty year base line which the Meteorological Office are using to measure climate changes against. The mean over this period was 1150mm. Over the past decade, the upper confidence limit which is expected to be exceeded in 2.5% of the observations (once in forty years) has been exceeded twice and the lower confidence limit has been exceeded once. This reinforces the increasing variability in rainfall over recent years.
The conclusion from this analysis is that annual rainfall in Paisley has increased from a low point in the early to mid 1970s to a high in the late 1980s and early 1990s. It has fallen slightly since then but the average from 2002-2011 is still almost 10% higher than the long term average from 1961 to 1990. Of perhaps more significance is the increased variability resulting from a trend for greater extremes of very dry and very wet years.These observations tend to support reports from global climate models that there is likely to be increased variability in weather patterns as a result of climate change.
If this trend continues it could have repercussions for managing water supplies and hydro electric generation on one side and floods and land slides on the other. Flooding are influenced more by individual storms or a sequence of storms more than by the total annual rainfall , however higher annual rainfall will tend to make the ground more waterlogged resulting in less water being absorbed by the ground during intense storms and hence greater chance of flooding.
In Part 2 of this article, monthly rainfall data will be examined to assess whether the seasons are changing.
Related Links:
Meteorological Office
Related Posts:
Here Comes the Rain, Part 2
Rest and be Thankful, but not about Climate Change
Another Landslide
The burning question is whether this is just the natural variability of weather or whether underlying climate change has a hand in driving these weather systems. To investigate this question, I have studied some local weather records. My statistical skills are about High School level: mean and standard deviation of a normal distribution.
Data for Glasgow Airport from 1959 to 2012 was obtained from the Meteorological Office website but the 2012 data was discarded as it is only provisional and represents an incomplete year. The data included monthly rainfall, sunshine and maximum and minimum temperatures and the focus of this study was the rainfall data.
Annual rainfall figures are plotted below as a time series. The y-axis (rainfall) is drawn from zero to give a clearer picture of the relative changes; some graphs cut off the bottom which can visually exaggerate trends. Without performing any statistical analysis, the first impression is that annual rainfall has increased from the early 1970s to the mid 1990s before increasing again from around 2000 to the present time. The variability from year to year also appears to be greater in the more recent results, especially in the 2000s.
The next graph presents the same data but also has a rolling average overlain. The rolling average is the average (mean) of the year and the nine preceding years. Each data point on this line is therefore a ten year average and this helps to smooth out the effects of a single particularly wet or dry years and gives a better impression of longer term trends. The choice if ten years as an averaging period is arbitrary but useful if comparing one decade with another. From the rolling average the upward trend from the early to mid 1970s until the late 1990s is quite clear although the 2000s have shown a steady decline which is less obvious from the individual results. The results do show that in the decade 2000-2009 there was 15% more rainfall than 1970-1979.
The final plot,below, shows the original data plotted alongside the 2 sigma values taken from the full data set from 1961 to 1990, a thirty year base line which the Meteorological Office are using to measure climate changes against. The mean over this period was 1150mm. Over the past decade, the upper confidence limit which is expected to be exceeded in 2.5% of the observations (once in forty years) has been exceeded twice and the lower confidence limit has been exceeded once. This reinforces the increasing variability in rainfall over recent years.
The conclusion from this analysis is that annual rainfall in Paisley has increased from a low point in the early to mid 1970s to a high in the late 1980s and early 1990s. It has fallen slightly since then but the average from 2002-2011 is still almost 10% higher than the long term average from 1961 to 1990. Of perhaps more significance is the increased variability resulting from a trend for greater extremes of very dry and very wet years.These observations tend to support reports from global climate models that there is likely to be increased variability in weather patterns as a result of climate change.
If this trend continues it could have repercussions for managing water supplies and hydro electric generation on one side and floods and land slides on the other. Flooding are influenced more by individual storms or a sequence of storms more than by the total annual rainfall , however higher annual rainfall will tend to make the ground more waterlogged resulting in less water being absorbed by the ground during intense storms and hence greater chance of flooding.
In Part 2 of this article, monthly rainfall data will be examined to assess whether the seasons are changing.
Related Links:
Meteorological Office
Related Posts:
Here Comes the Rain, Part 2
Rest and be Thankful, but not about Climate Change
Another Landslide