Here Comes the Rain - Part 2
It is official. Britain has had the wettest summer since 1912 according to the Meteorological Office. This follows one of the wettest springs on record. Is this evidence of climate change or simply natural variation in the weather?
To try answering this question, data from a weather station near Glasgow has been analysed . The first part of this article presented annual rainfall records and concluded that there has been only a slight increase in annual rainfall over the past decade compared with a baseline of 1961 to 1990 but that there had been a marked increase in variability. Also of interest is whether rainfall patterns have changed throughout the year, from month to month and between the seasons which is the subject of this post.
In order to provide some context, June 2012 was the wettest recorded June in 54 years with 130mm of rainfall which is almost double(196%) the average rainfall for the month and July is the fourth wettest with 75% more than average. Apart from this year, the five wettest Junes were followed by an average or below average July and likewise the five wettest Julies were preceded with a dry or average June. Data for August 2012 has yet to be published.
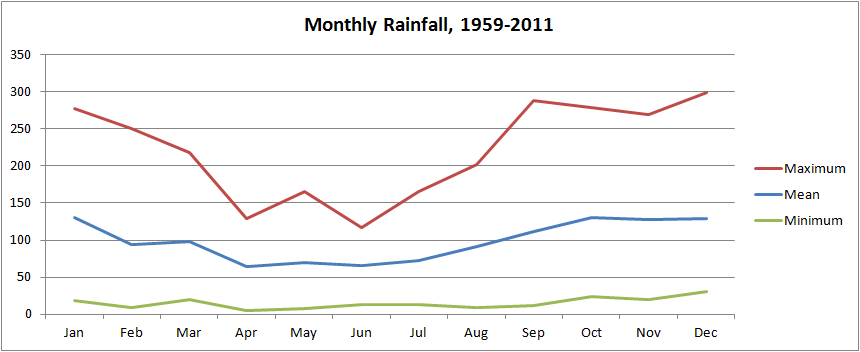
Over the fifty three complete years of data examined, there are wide variations in rainfall for each month as demonstrated by the monthly mean, maximum and minimum values plotted below. In some months the minimum values are almost zero while the maximum values may be almost three times the minimum.
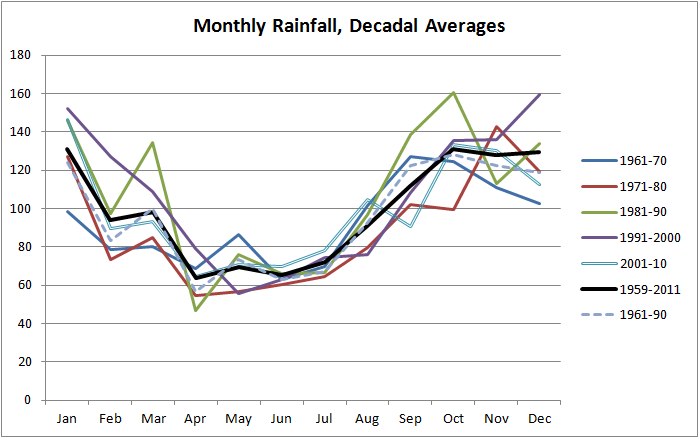
The monthly averages for each decade from the 1970s to the 2000s are plotted below against along with the mean from the period 1959 to 2011 and the mean from 1961 to 1990, which was used as the baseline in the previous post. It is difficult to take anything from this graph. the patterns of spring and autumn rainfall appears different in the 1980s compared with the longer term averages but the most recent decade tends to follow the long term averages, albeit with slightly higher values which reflect the increase in annual rainfall.
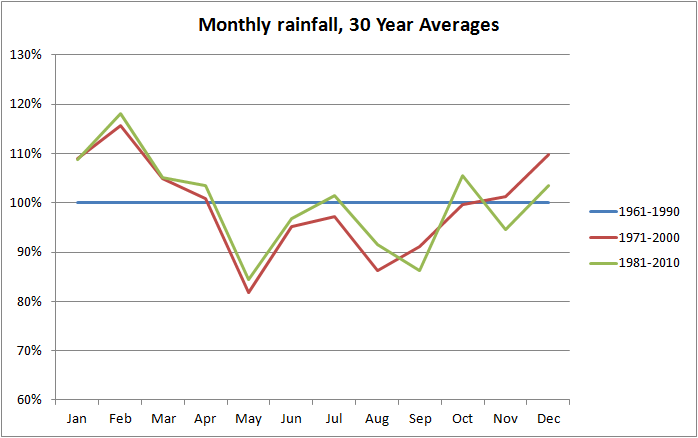
In order to eliminate the effect of annual variations, the percentage of each year’s rainfall has been calculated for each month. Long term thirty year averages have then been taken as a percentage of the 1961-1990 base line average. This shows that there has been a trend towards wetter winters and a dryer period in late spring, however the relative closeness of the pattern in the latter two periods may suggest that the baseline period had dryer winters than normal.
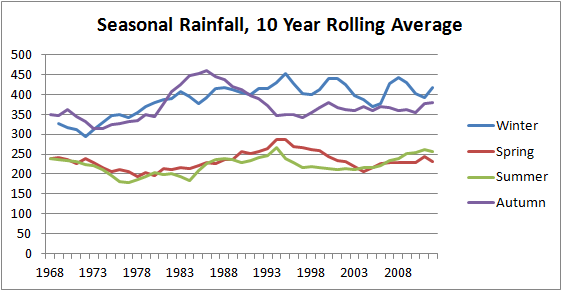
Looking at the seasons, the ten year rolling average for Autumn (September, October and November) and Winter (December, January and February) were lower through the 1960s and 1970s before increasing to their current levels in the 1980s and 1990s with considerable variability, especially in winter. The summer is generally less variable and while there is currently an upward trend it could be part of a longer cycle of increasing and decreasing Much of the increase in annual rainfall and the increased variation in rainfall can be attributes to changes in winter rainfall as shown below.
In the Glasgow area, it would appear that this particularly wet summer is not part of a trend but a one off anomaly. It is also interesting to note that, with all the rain, the number of hours of sunshine this July were half of the long term average, but that will be another post.
Some climate models suggest that weather patterns will become more variable and unpredictable, which can make anomalous results more likely but the historical record does not yet confirm it. This good because once significant changes are confirmed by the historical records it will be too late.
I would be interested to see how weather patterns are changing in other places around the world. What changes are happening where you are?
Related Links:
Meteorological Office
Related Posts:
Here Comes the Rain, Part 1
Rest and be Thankful, but not about Climate Change
Another Landslide
To try answering this question, data from a weather station near Glasgow has been analysed . The first part of this article presented annual rainfall records and concluded that there has been only a slight increase in annual rainfall over the past decade compared with a baseline of 1961 to 1990 but that there had been a marked increase in variability. Also of interest is whether rainfall patterns have changed throughout the year, from month to month and between the seasons which is the subject of this post.
In order to provide some context, June 2012 was the wettest recorded June in 54 years with 130mm of rainfall which is almost double(196%) the average rainfall for the month and July is the fourth wettest with 75% more than average. Apart from this year, the five wettest Junes were followed by an average or below average July and likewise the five wettest Julies were preceded with a dry or average June. Data for August 2012 has yet to be published.
Over the fifty three complete years of data examined, there are wide variations in rainfall for each month as demonstrated by the monthly mean, maximum and minimum values plotted below. In some months the minimum values are almost zero while the maximum values may be almost three times the minimum.
The monthly averages for each decade from the 1970s to the 2000s are plotted below against along with the mean from the period 1959 to 2011 and the mean from 1961 to 1990, which was used as the baseline in the previous post. It is difficult to take anything from this graph. the patterns of spring and autumn rainfall appears different in the 1980s compared with the longer term averages but the most recent decade tends to follow the long term averages, albeit with slightly higher values which reflect the increase in annual rainfall.
In order to eliminate the effect of annual variations, the percentage of each year’s rainfall has been calculated for each month. Long term thirty year averages have then been taken as a percentage of the 1961-1990 base line average. This shows that there has been a trend towards wetter winters and a dryer period in late spring, however the relative closeness of the pattern in the latter two periods may suggest that the baseline period had dryer winters than normal.
Looking at the seasons, the ten year rolling average for Autumn (September, October and November) and Winter (December, January and February) were lower through the 1960s and 1970s before increasing to their current levels in the 1980s and 1990s with considerable variability, especially in winter. The summer is generally less variable and while there is currently an upward trend it could be part of a longer cycle of increasing and decreasing Much of the increase in annual rainfall and the increased variation in rainfall can be attributes to changes in winter rainfall as shown below.
In the Glasgow area, it would appear that this particularly wet summer is not part of a trend but a one off anomaly. It is also interesting to note that, with all the rain, the number of hours of sunshine this July were half of the long term average, but that will be another post.
Some climate models suggest that weather patterns will become more variable and unpredictable, which can make anomalous results more likely but the historical record does not yet confirm it. This good because once significant changes are confirmed by the historical records it will be too late.
I would be interested to see how weather patterns are changing in other places around the world. What changes are happening where you are?
Related Links:
Meteorological Office
Related Posts:
Here Comes the Rain, Part 1
Rest and be Thankful, but not about Climate Change
Another Landslide
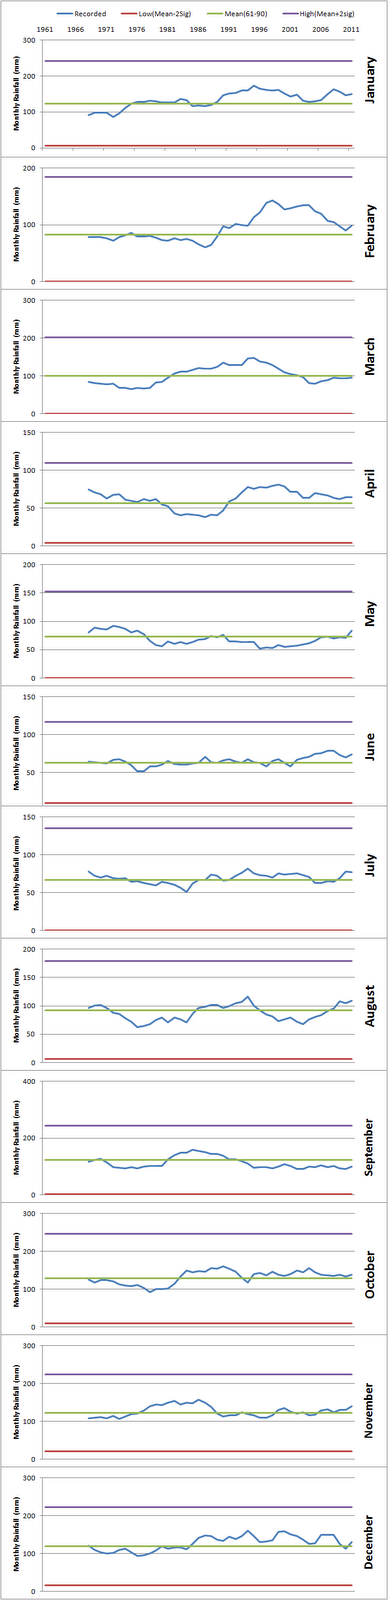 |
| 10 year mean monthly rainfall for each month |